
← Screen Use & Air Conditioning
Austin Energy Chart
By Doug, the Screen Guy | Published August 19, 2010 | Full size is 565 × 616 pixels
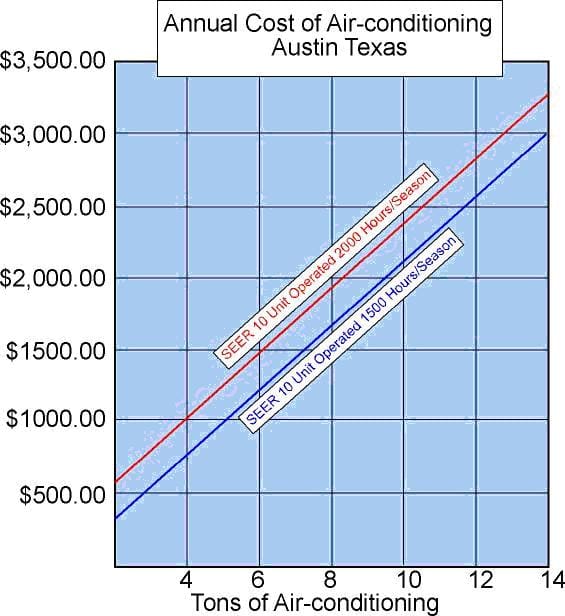
Graph showing the potential savings in dollars with a 25% reduction in air conditioning use for a range of air-conditioning sizes.
Color chart demonstrating the average annual cost of running an air conditioner in Austin, TX.
Bookmark the permalink.